Population Size Trends of Mission San Juan Capistrano - a Simple Analysis
 I'm currently finishing two books, one on Saint Junípero Serra's time in Orange County and Mission San Juan Capistrano, and another expanded version of Bouchard's attack on the mission. In the mean time, I wrote this article analyzing population statistics at the mission during its years of operation. I will attempt to publish the footnoted version of this article in the future.
Population Size Trends of Mission San Juan Capistrano - a Simple Analysis
The policies of the Catholic Church required the missionaries in Spanish and Mexican Alta California (roughly 1769-1848) to record each baptism, marriage, and burial in all outposts in the province. Furthermore, the missionaries at each mission wrote annual reports that included data on the number of inhabitants, marriages, and burials at each mission. Additionally, the Father President (head of the missionaries of the province) wrote biannual reports to colonial authorities in Mexico reporting much of the same information. Fortunately for historians, many of these records survive today. While the statistical data they preserve is not perfect (this author has found minor discrepancies), they provide valuable demographic data for the historian, anthropologist, and genealogist.
While these data have been readily available since Father Zephyrin Engelhardt published his mission histories in the early twentieth century, modern tools for data analysis (such as Google Sheets), make analyses of these data far easier and accessible. Furthermore, in recent years, the Huntington Library developed an online database, The Early California Population Project, that contains nearly all of the extant records from the baptismal, marriage, and burial registers at all of the missions and presidios. This extensive database can help identify the Indian villages that were the sources of baptized Indians (called neophytes by the Spanish) during periods with relatively high rates of baptisms.
Using these tools, a simple analysis of the data from the mission registers at San Juan Capistrano can illuminate aspects of the community’s story, while also inviting further research in pursuit of answers to questions that arise. The following four charts are by no means objective, but are intended to serve as an exercise in making sense of the story of Mission San Juan Capistrano, from its founding in 1776 until its secularization (or official end as a mission under the missionaries’ control and breaking up of the mission lands into ranchos) in 1834. The data is split into three eras, defined by regression trends in the data:
1. 1776-1796: This period is characterized by a rising number of total neophytes (baptized Indians) at the mission, except for two years, 1785-1786, when the number was stable, and 1789-1790 when the number marginally decreased.
2. 1797-1812: This period begins with a stabilization in population in the years 1797-1798, and is followed by the first multi-year decline in the total number of neophytes in the mission’s history. Following this decline, the population again experienced a multi-year increase.
3. 1812-1834: This period is characterized by a decreasing number of total neophytes at the mission, excepting only marginal increases in the years 1821-1823, 1825-1826, 1830-1831.
What follows is a discussion on the data and its possible causes and implications. Throughout this analysis, the reader must consider that statistical analyses can often neglect the human stories behind every statistic. A difference of just one in any of the following data is a difference in the story of an individual person, ostensibly affecting their family, friends, and the community at large. The intention of the author is for this analysis to assist in the reclamation of the human stories of the individuals who were a part of this community.
Chart 1
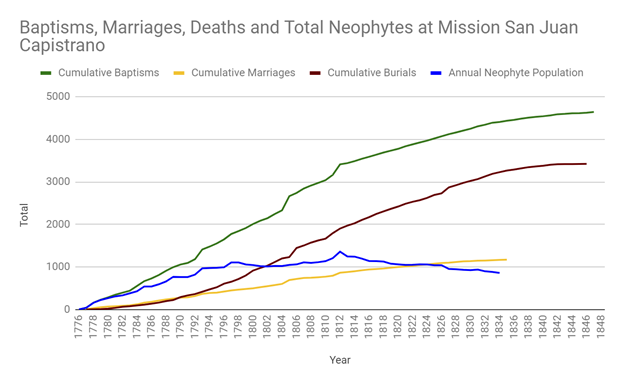
This chart shows the cumulative totals of baptisms, marriages, and burials at the mission, as well as the annual neophyte population. The following are observed:
1. After a generally consistent rise in the cumulative totals in the years 1776-1812 (except perhaps a slower rate of increase in burials in the mission’s first decade or so compared to the following couple decades), thereafter the cumulative totals show a less pronounced, but more consistent, increase from year to year.
2. The population generally increased from 1776 through 1797, stabilized (or declined) before rising again in the years 1797-1812, and then generally declined from 1812-1834.
3. The burial rate started to increase in the 1790s, perhaps due to more crowded living conditions that facilitated the spread of disease. The rate maintains a relatively high level from 1800 through the 1820s, when it begins to slowly decline. Notable increases in the burial rate occur in about 1799-1800, 1805-1806, 1810-1812, 1826-1827.
4. The post-secularization data (post-1834) tallying baptisms and burials started to flatten out, suggesting that the population was significantly smaller compared to the mission era.
Chart 2

This chart shows the neophyte population in the years 1776-1797 with a trendline. The following is observed:
1. The linear regression equation (at right) for the trendline shows that an average of about 51 Indians were baptized annually throughout this period, with a high goodness of fit (R-squared = 0.987).
2. Notable periods of population increase occurred from 1778-1779, 1784-1785, 1788-1789, and 1792-1793. The following is a brief discussion on possible explanations for these pronounced increases:
a. 1778-1779: In October, 1778 the mission was moved to its current location from its original founding site further up San Juan Canyon. The move prompted more baptisms from the large village of Pange, located near the coast in San Mateo Canyon, which may suggest an increasing rate of missionaries taking a coastal route along a new path of Camino Real that provided easier access to the new site of the mission from San Diego (the previous route of El Camino Real was further inland and bypassed Pange). Similarly, there was an increase in the number of baptisms from villages of Axachme and Putiidum, both of which were near the current mission site. There were also notable increases in the number of baptisms from the village of Tumume, which may have been located along Aliso Creek near Laguna Beach.
b. 1784-1785: There were notable increases in the number of baptisms from the villages of Gengaa, Pasbenga, and Totabit, all of which were located along the Santa Ana River, suggesting that the missionaries started to at the very least missionize regions along the river at this time. It should also be considered that the missionaries may have been actively developing areas along the river for the mission’s needs, especially given its growing population. These developments may have included using the lands adjacent to the river for grazing, or even for raising crops.
c. 1788-1789: Notable baptisms from villages such as Pacheme (possibly Paixba, which may have been located in the Temescal Valley), Quigaia, located in the Santa Margarita watershed, and Queech (possibly Quechinga, which was located near the site of today’s Mission San Luis Rey), may suggest that the missionaries were working in areas south of the mission that were later under the jurisdiction of Mission San Luis Rey.
d. 1792-1793: Significant increases in the number of baptized neophytes from Pange (located in San Mateo Canyon along the coast) and Alauna (located along Trabuco Creek in O’Neill Park) may suggest that the mission established estancias, or mission stations, in these two areas during this period. Both locations were later recorded as having adobes. The implication may be that local food supplies for the Indian villages were significantly impacted by mission livestock and land developments, essentially forcing the Indians into becoming neophytes at the mission.
3. The period is characterized by relatively large population increases. These increases may have been an important factor behind the missionaries’ commencement of plans to build the Great Stone Church in 1796.
Chart 3

This chart shows the changes in the neophyte population at the mission in the years 1797 to 1812 with a trendline. The following is observed:
1. Linear regression does not adequately describe these data (R-squared has a value of 0.383 with an average increase in neophyte population of about 11 during this period, compared to 51 in the years 1776-1796), rather a polynomial regression is appropriate (note that R-squared has a value of 0.905). This is significant because it shows that the mission population no longer experienced long-term sustained multi-year growth.
2. A notable decline in population occurred during the years 1798-1802, likely because neophytes who were originally from villages under the jurisdiction of newly established Mission San Luis Rey (founded in 1798) were able to transfer to that mission to be closer to their home villages.
3. An increase in the total neophyte population occurred between 1803-1812, although there was a slight decline 1807-1808, possibly due to a pandemic ravaging the neophyte population, but also perhaps because there was a decreasing number of villages to draw neophytes from within the mission’s territory.
4. The mission reached its highest recorded population of 1,361 in 1812, which was the same year an earthquake struck the mission, bringing down the Great Stone Church and killing forty neophytes (had the earthquake not occurred, the population would have ostensibly been 1,401). A large number of neophytes were baptized in 1812 from the villages of Guaromo, Pamechic, and Pilmic. Guaromo may have been located in Santiago Canyon, perhaps near the growing Yorba and Peralta families’ Rancho Santiago de Santa Ana. It seems Pamechic and Pilmic may be alternate names for the same village, which seems to have been located somewhere inland, perhaps in Temescal Valley. The implication is that the Indians being baptized in 1812 were largely from villages that were relatively further away from the mission.
5. Increasing traffic from foreign vessels anchoring in San Juan Bay (Dana Point) to trade while pursuing sea-otter pelts characterizes this period, perhaps contributing to an increase in the number of diseases spreading among the 1000+ neophytes living in relatively close quarters at the mission.
Chart 4
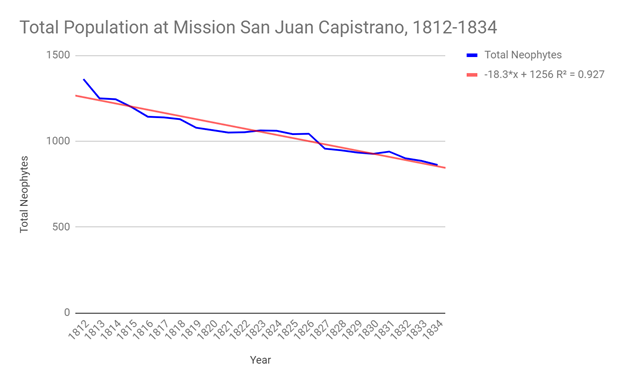
This chart shows the neophyte population in the years 1812 through secularization in 1834 with a trendline. The following is observed:
1. The linear regression equation (at right) shows that the mission was losing on average about 18 neophytes a year (R-squared = 0.927); compare this average annual loss of 18 neophytes a year with an average annual gain of 51 in the years 1776-1796, and an average annual gain of 11 in the years 1797-1811.
2. The decline started from the peak neophyte population recorded of 1,361 in 1812. Several possible reasons should be investigated for their role in the decline:
a. Mission San Gabriel to the north and Mission San Luis Rey to the south (and operating to the east in Temescal Valley) were much larger establishments in terms of land holdings, allowing them to continue to baptize Indians from far away villages. Mission San Juan Capistrano no longer had villages to draw Indians from for baptisms.
b. The destruction of the Great Stone Church may have had a demoralizing effect on Indians considering baptism at Mission San Juan Capistrano.
c. Increased visitation by foreigners continued to contribute to disease pandemics.
3. A notable decline occurred in the years 1826-1827, which was when Governor Echeandia started the process of allowing some Indians to declare themselves free of the mission’s control. In pursuit of work, it seems many of them may have moved to neighboring ranchos (the Yorba and Peralta’s Santiago de Santa Ana or Nieto’s Rancho Los Nietos, for example) or to the Pueblo of Los Angeles.
Conclusion
The demographic story of Mission San Juan Capistrano can roughly be divided into three eras: 1. A period of growth, 1776-1796. 2. A period of instability, 1797-1812. 3. A period of decline, 1813 through secularization in 1834. Further statistical analysis can be used to help understand the impact of major events at the mission, and the effects of policies initiated by the government. Further study could be enhanced by combining crop production and livestock data to help answer questions related, but not restricted, to the chronology of the mission’s development and incursion into surrounding lands, the carrying capacity of both the local food supplies and what was needed to support the mission population, and how the mission was administered during its operational years.
Bibliography
Brigandi, Phil and Plunkett, Eric. The Portolá Expedition in Orange County. Santa Ana: Orange County Historical Society, 2019.
Engelhardt, Zephryn, San Juan Capistrano Mission. Los Angeles: The Standard Printing Co., 1922.
Fages, Pedro. The Colorado River Campaign 1781-1782 Diary of Pedro Fages. Ed. Herbert Ingram Priestley, Assistant Curator Academy of Pacific Coast History. Vols. 3, No. 2. Berkeley: University of California Berkeley, 1913.
Hackel, Steven W., Jeanette Zerneke and Natale Zappia. Early California Cultural Atlas. 2015. <http://ecai.org/ecca/>.
Johnson, John R. and O’Neil, Stephen. Descendants of Native Communities in the Vicinity of Marine Corps Base Camp Pendleton, An Ethnohistoric Study of Luiseño and Juaneño Cultural Affiliation. Santa Barbara: Science Applications International Corporation, 2001.
Meadows, Don. "The Original Site of Mission San Juan Capistrano." Southern California Quarterly 49.3 (September, 1967): 337-343.
The Early California Population Project: A Database Compiled and Developed at the Huntington Library. General Editor, Steven W. Hackel, Lead Compiler, Anne M. Reid. (The Henry E. Huntington Library, San Marino, California, 2006.)
Part 6: The Great Stone Church (A future post)
Part 10: Richard Henry Dana at Dana Point
